
 Parts of the south Atlanta real estate market are showing signs of weakness, a general lethargy. While the broad region is largely stable, several areas of the metro area are flashing yellow. These areas are mainly south of I-20 where a significant amount of post pandemic activity was experienced. Similar traits were noted during the '08-'12 bubble-crash, increased attention and then giving back the gains made. As then, we see the influences of builders, ownership programs, and speculators possibly at play. This is a different housing market, but patterns are developing which should be watched.
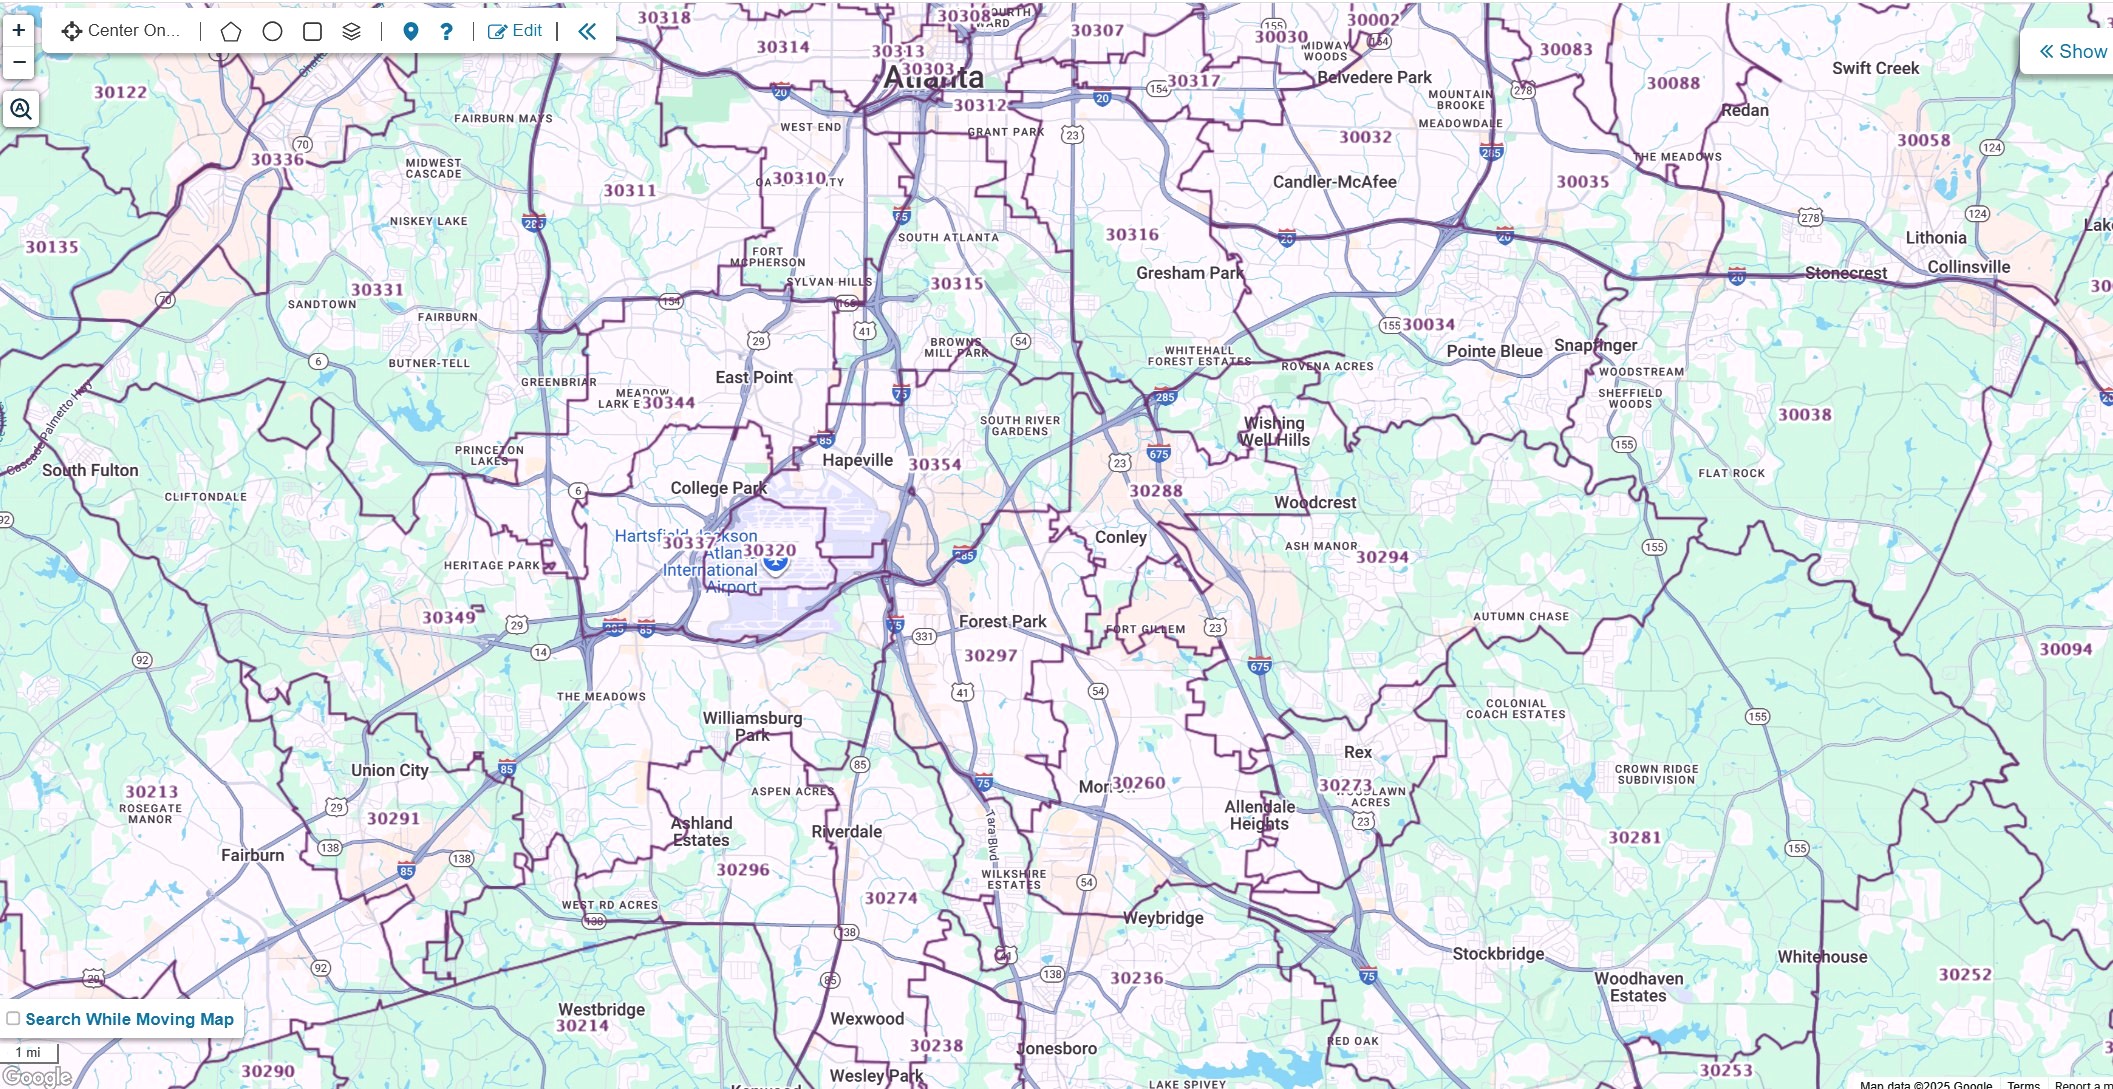
These maps from ResiClub focus on those markets (by zip) south of I-20. For reference, the FMLS zip code map below provides a general idea of layout. Admittedly, not great map but it complements the data maps from ResiClub and at least offers points of reference.
Atlanta FMLS Map
Active Inventory YOY (Sept '24 - Sept '25)
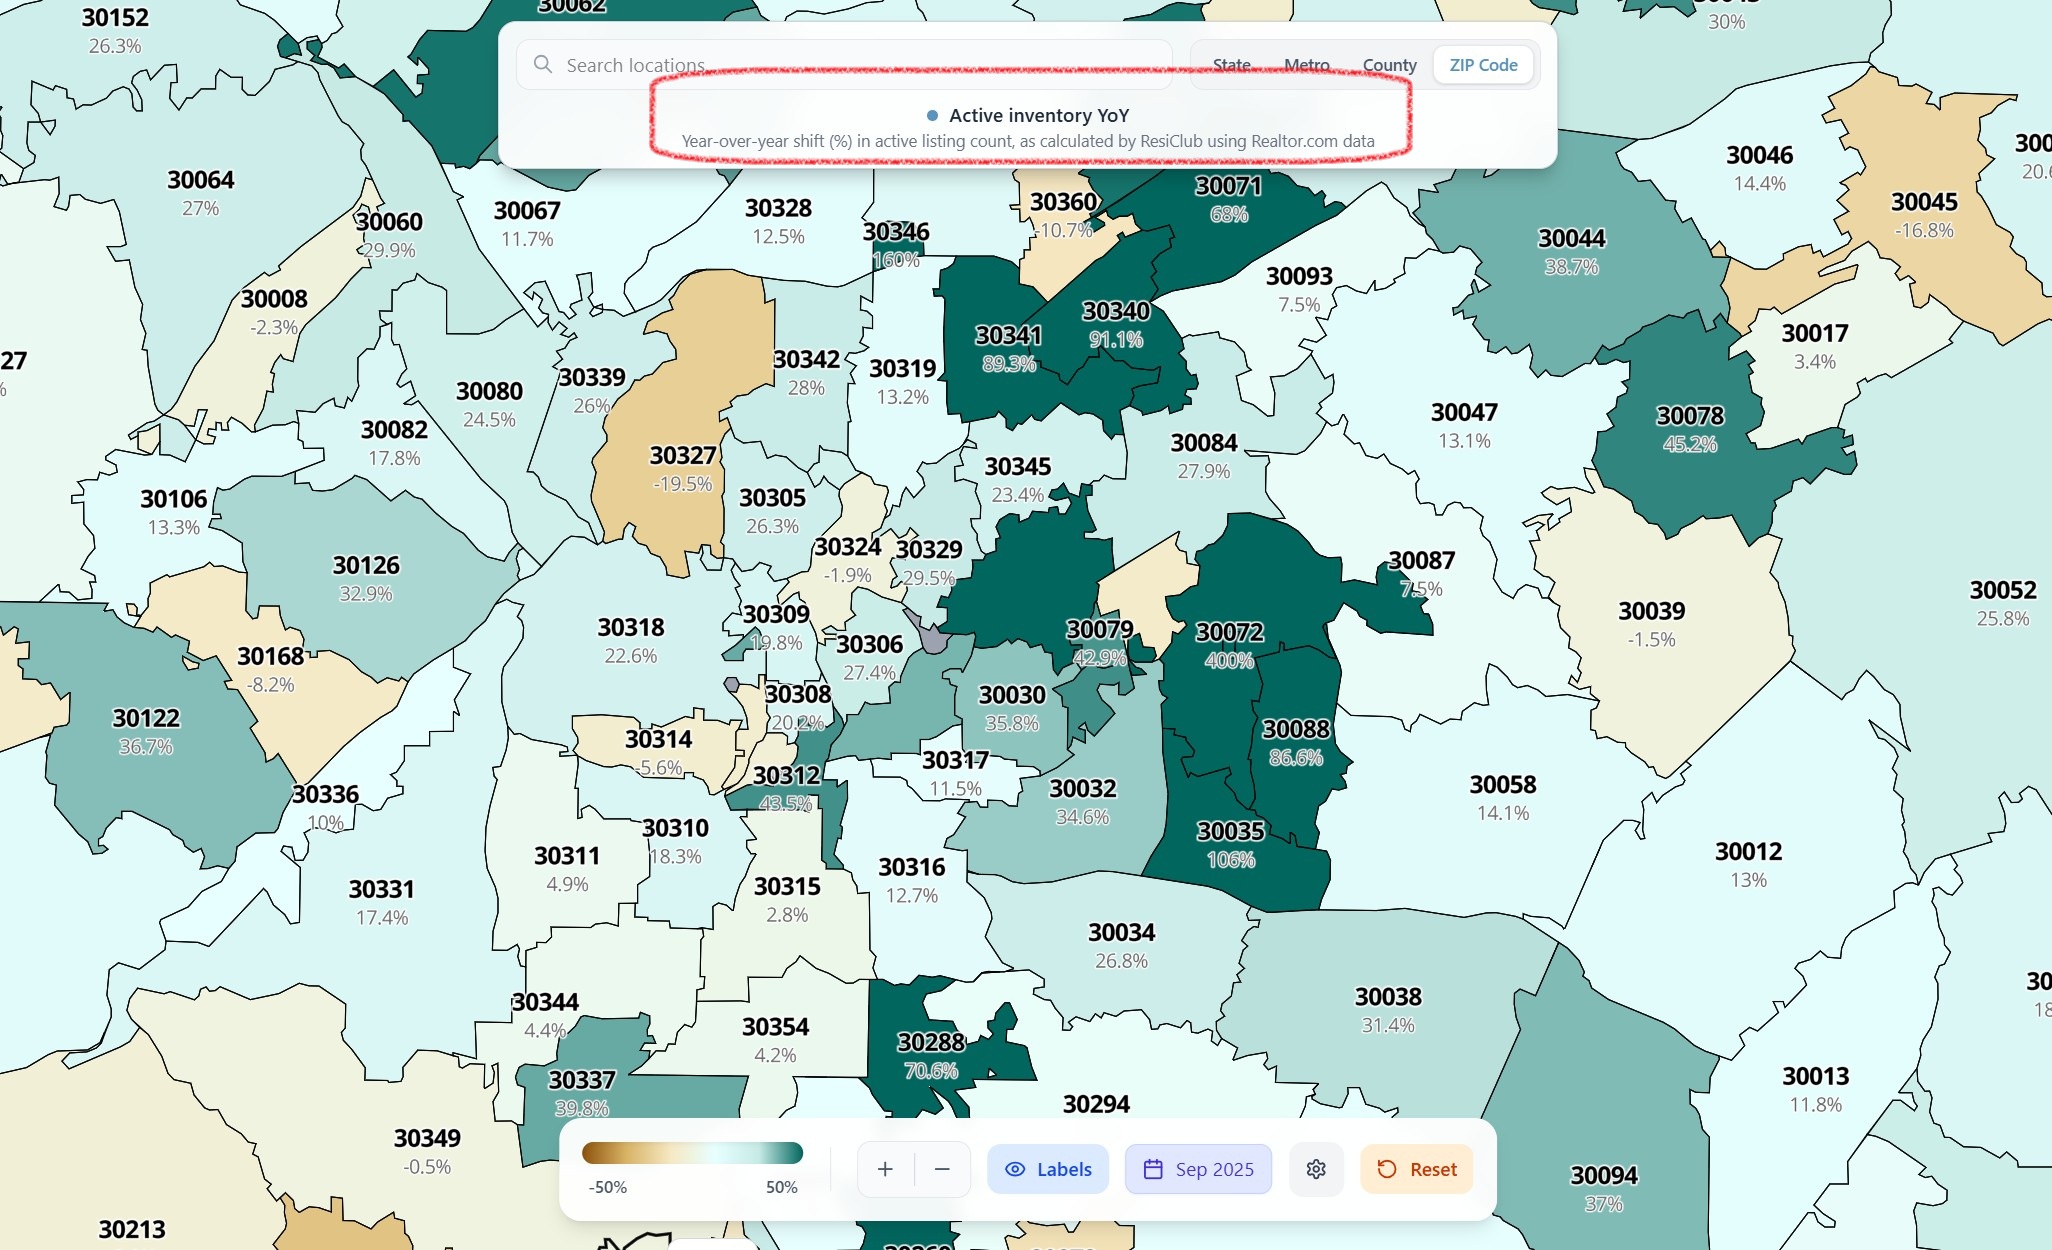
- New construction slowed significantly as buyers on the edge couldn't move or fell into rentals
- Builders will resort to price cuts and incentives to move inventory, potentially driving prices down
- Both resale and new homes are seeing extended marketing times
Active Inventory Sept '24 vs Sept '19
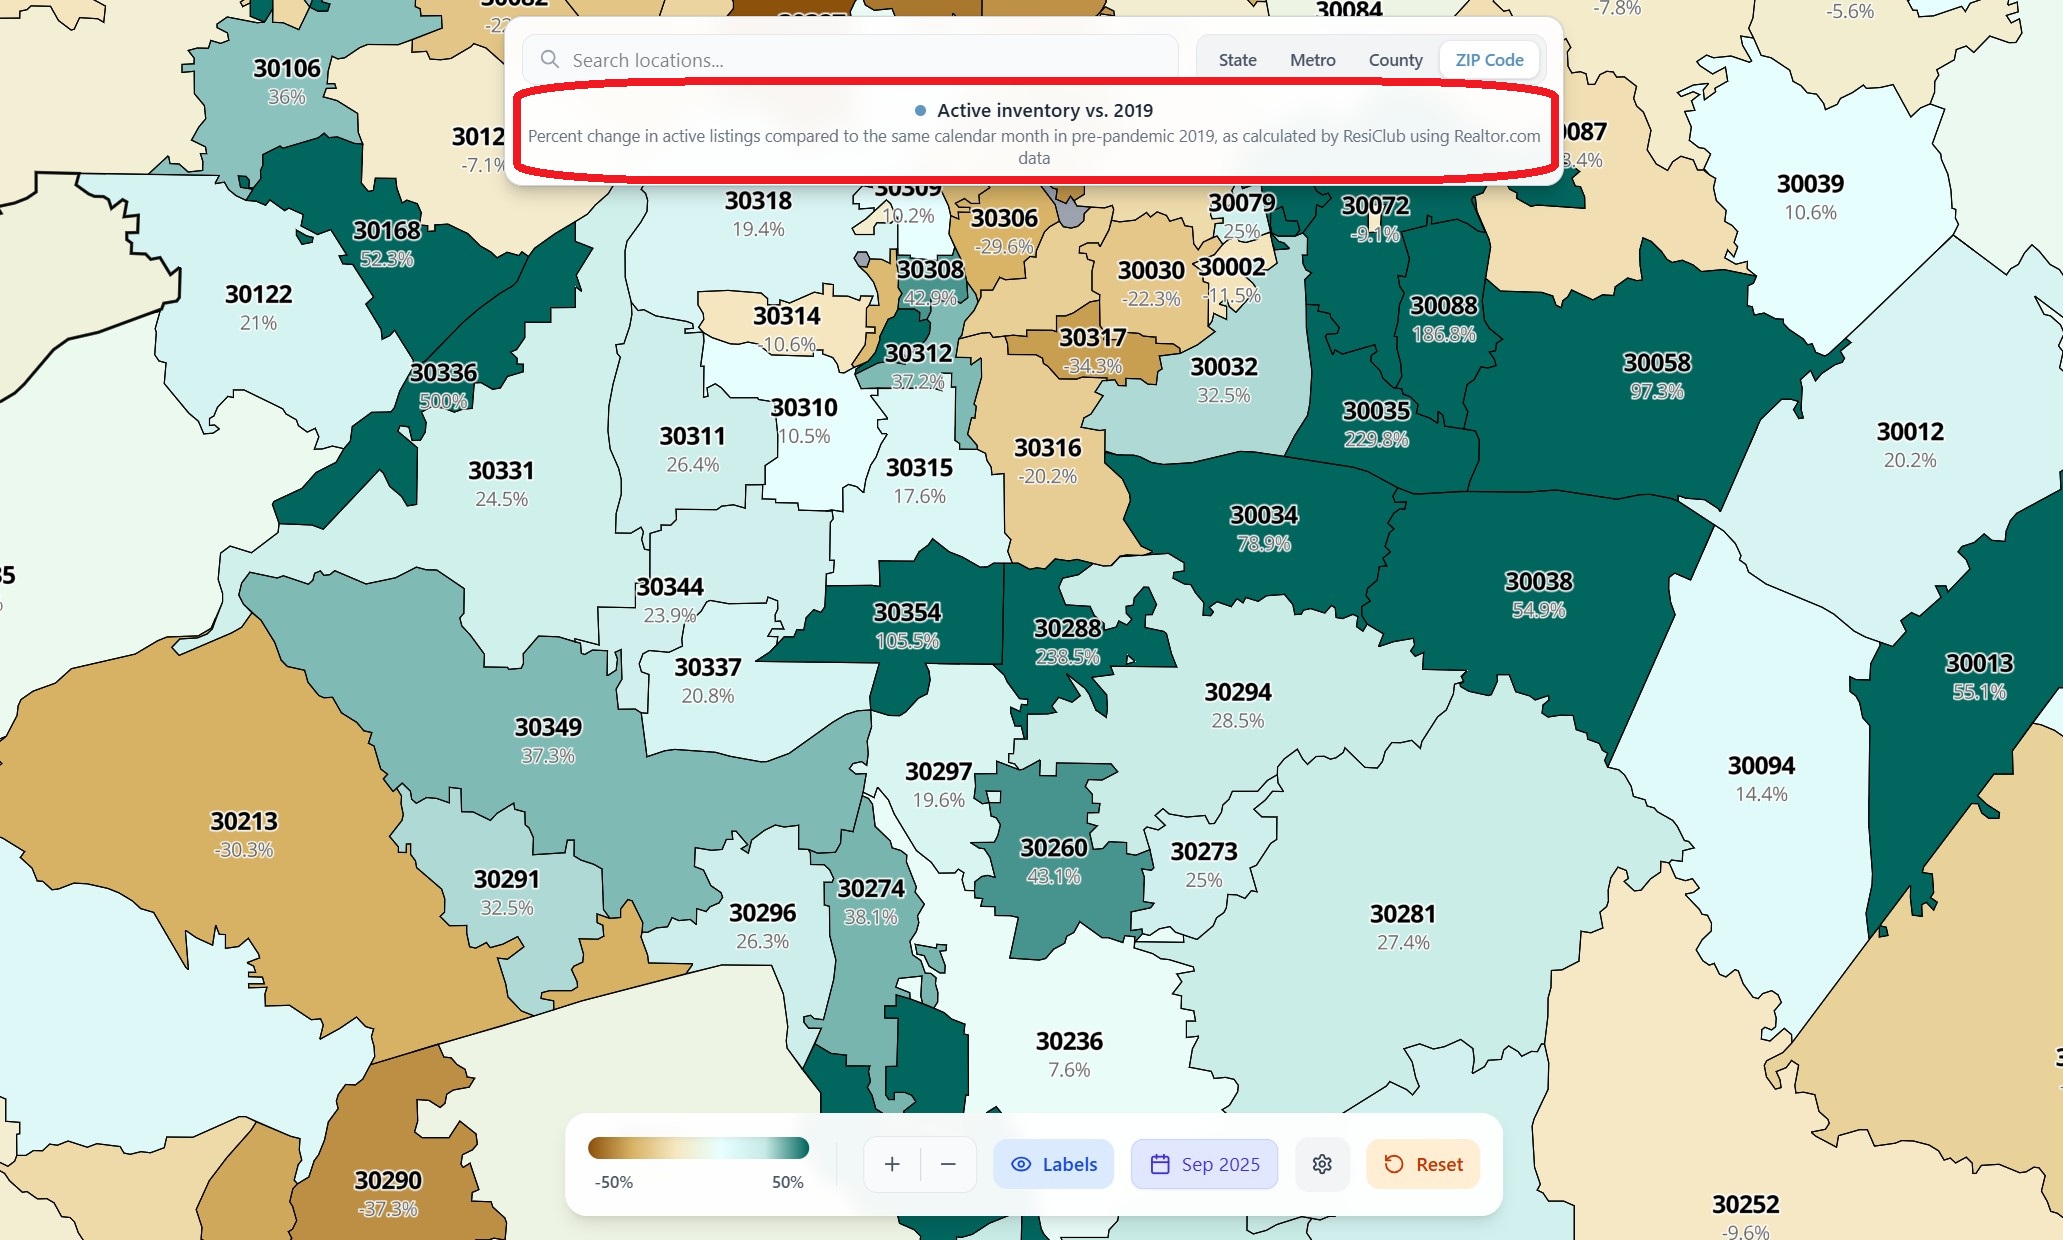
- The SE area was highly involved last crash, we see inventory accumulating here again
- Areas closer to the the center of Atlanta seem to be a bit tighter
- The disparity between zips is, in some cases adjacent to each other, is stark
Percentage of Atlanta Listings with Price Reductions
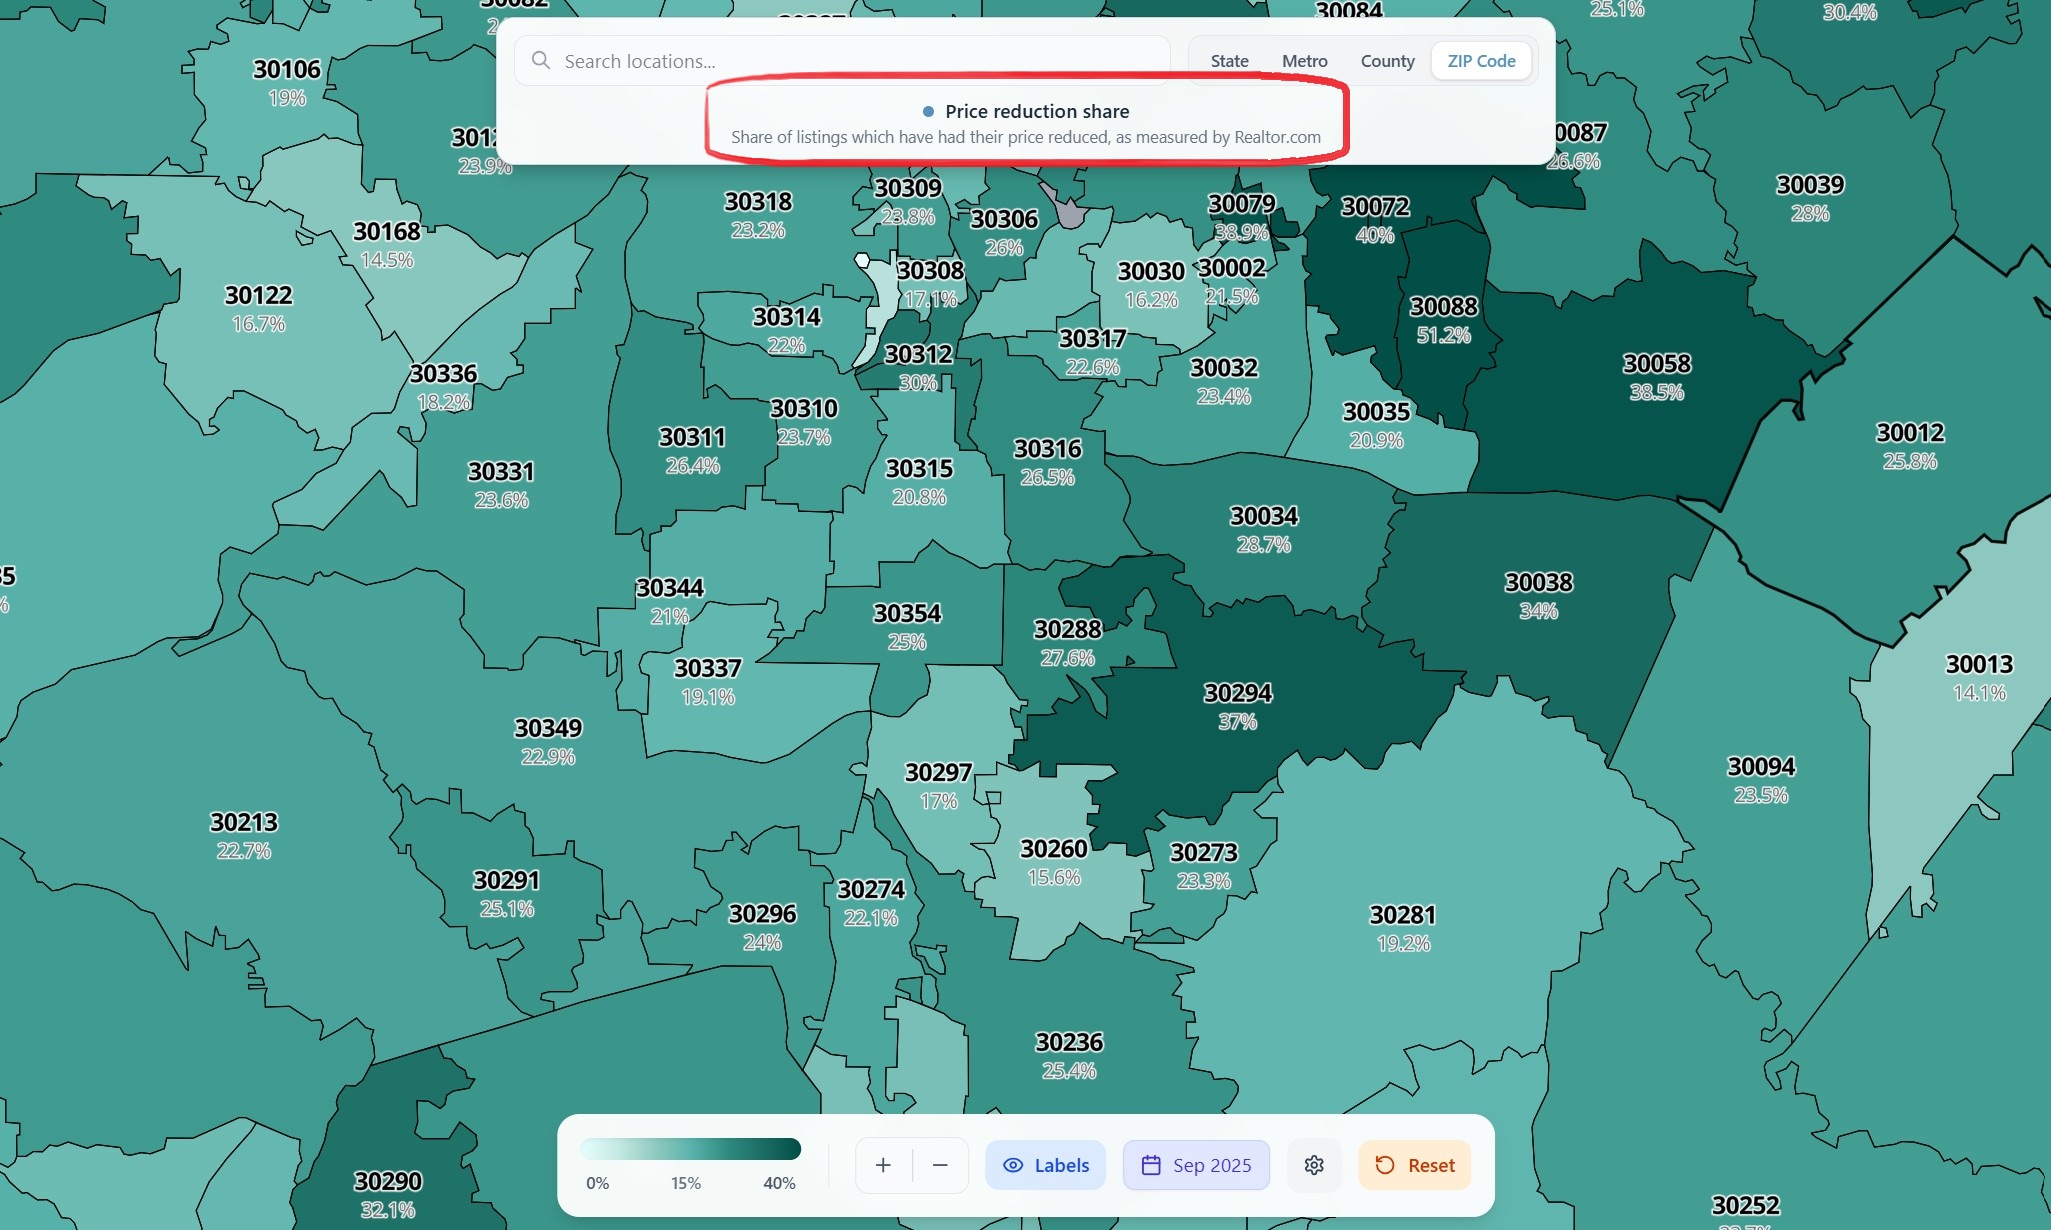
- No surprises here and while on the high side, reductions are common across the region
- Many of these sellers overpaid and are trying to sell without loss
- Builders are slashing prices as needed to move inventory
Atlanta Home Prices YOY (Sept '24 - Sept '25)
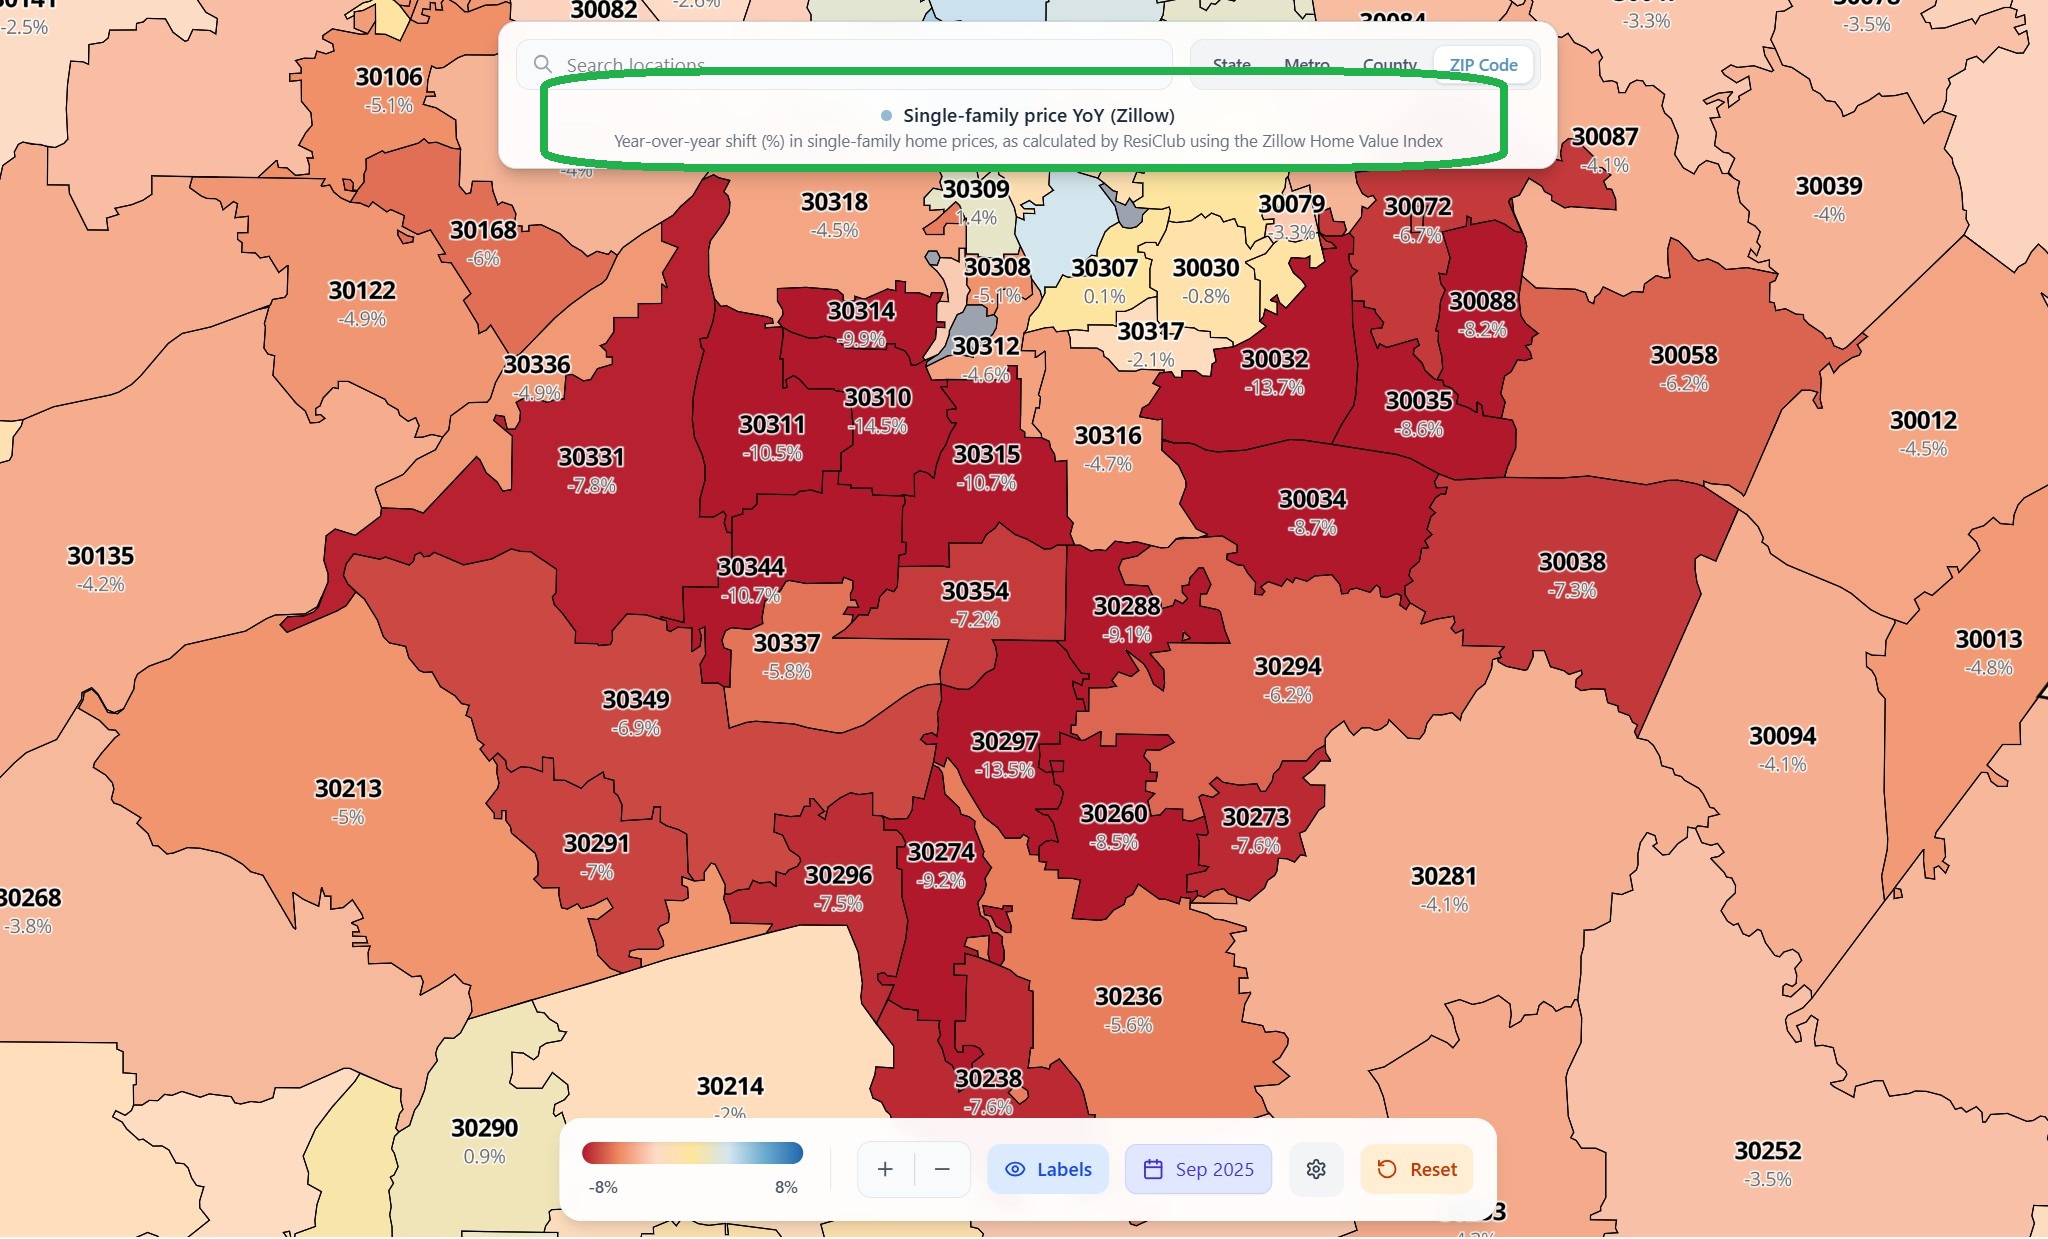
- The insane increases during '21-'22 were unsustainable, values had to settle
- This region is tops in the Greater Atlanta market for YOY price drop
- This is a Sept '24-'25 snap, but the pattern has been largely consistent
Atlanta Home Prices Since the Peak
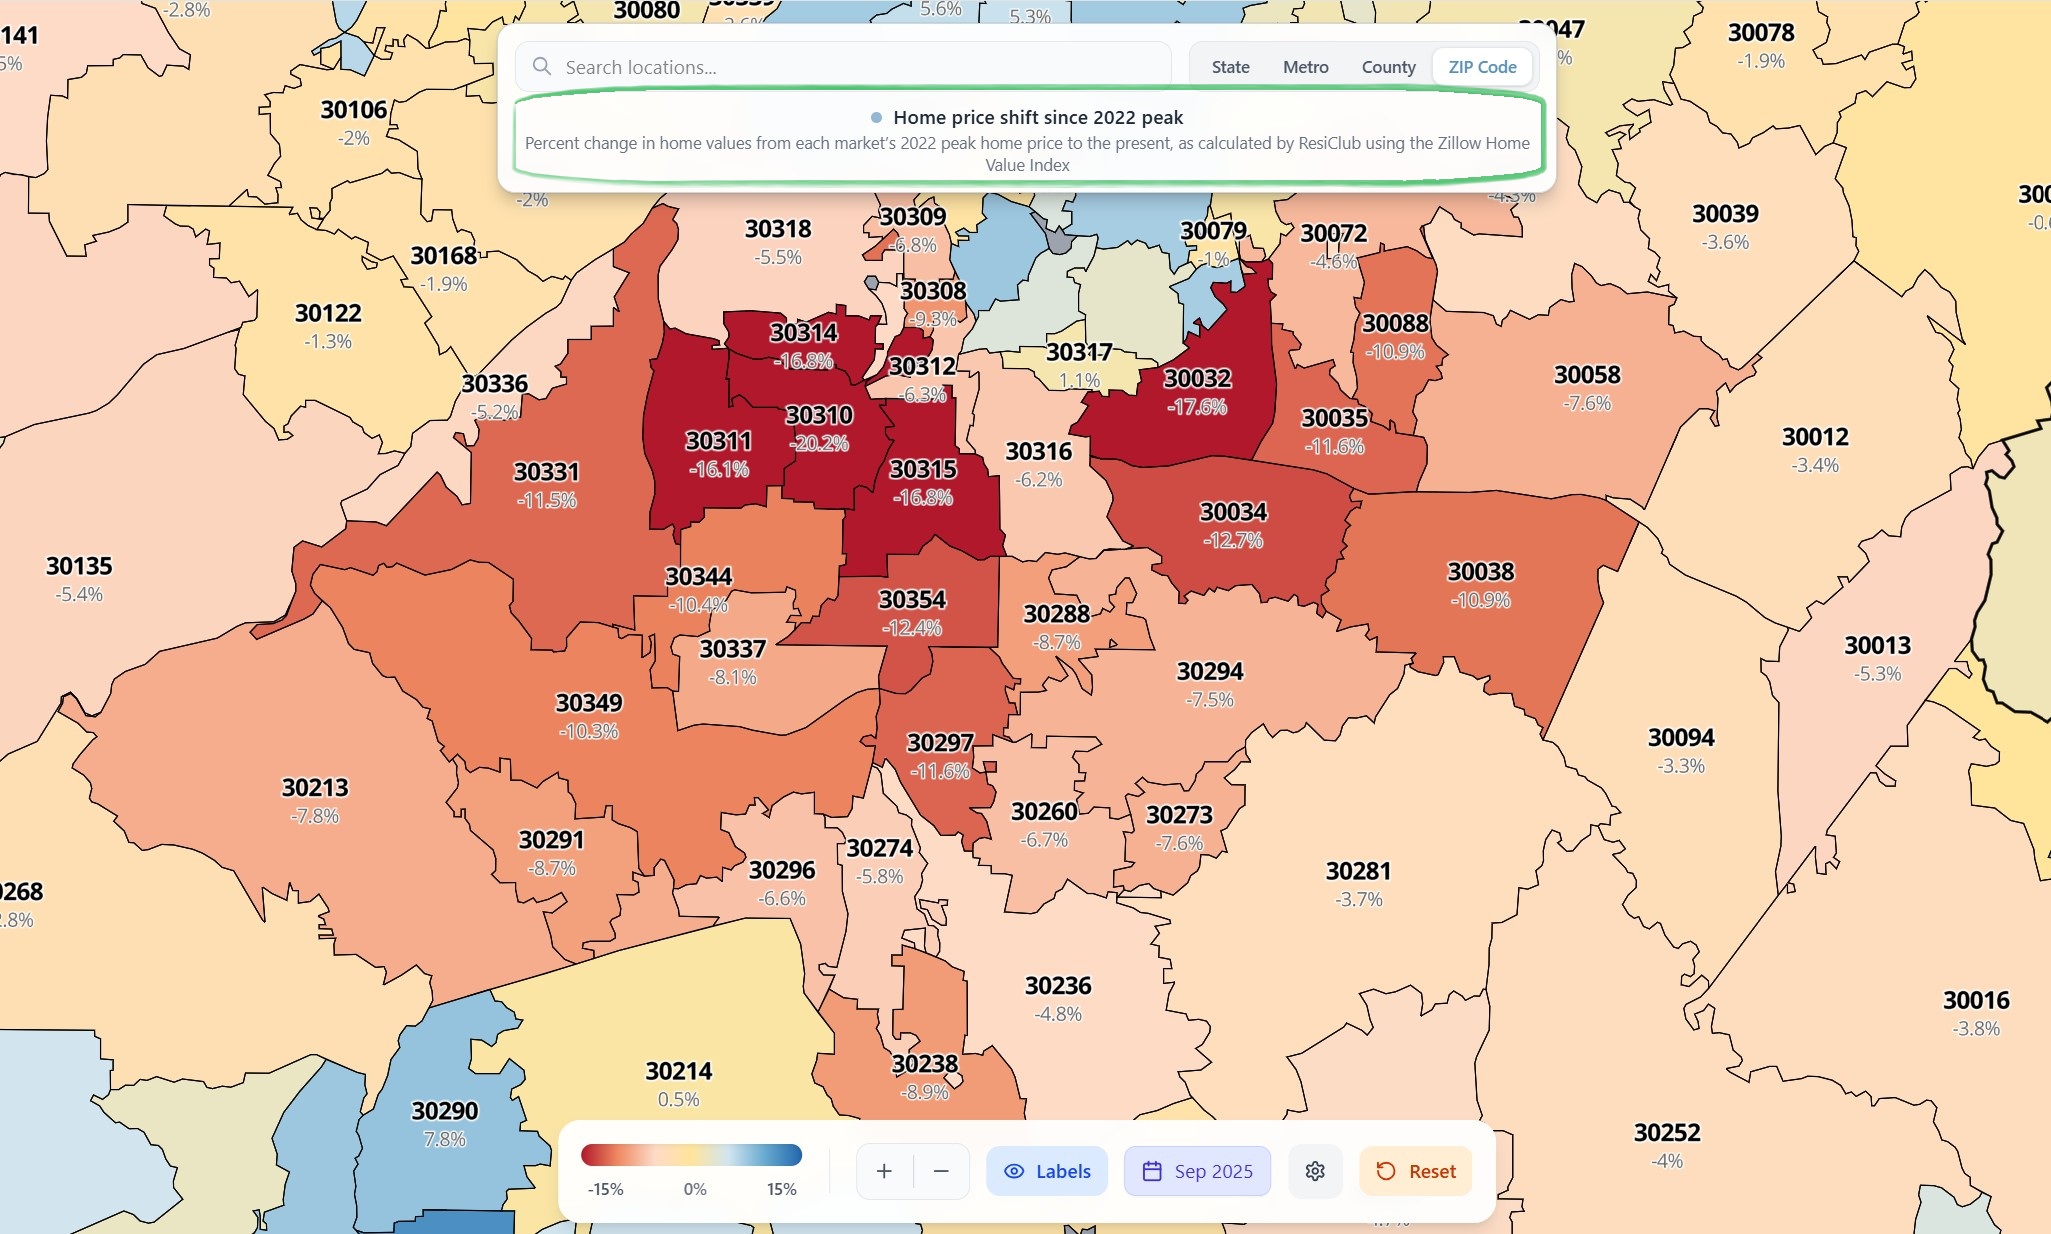
- "Peak to Trough" comparisons are always stark, but several zips here are noteworthy
- Concentrated weakness, more normal price flex in the edge areas
- Important to watch for sellers dumping inventory just to leave these zips
Atlanta Home Change Since March '20
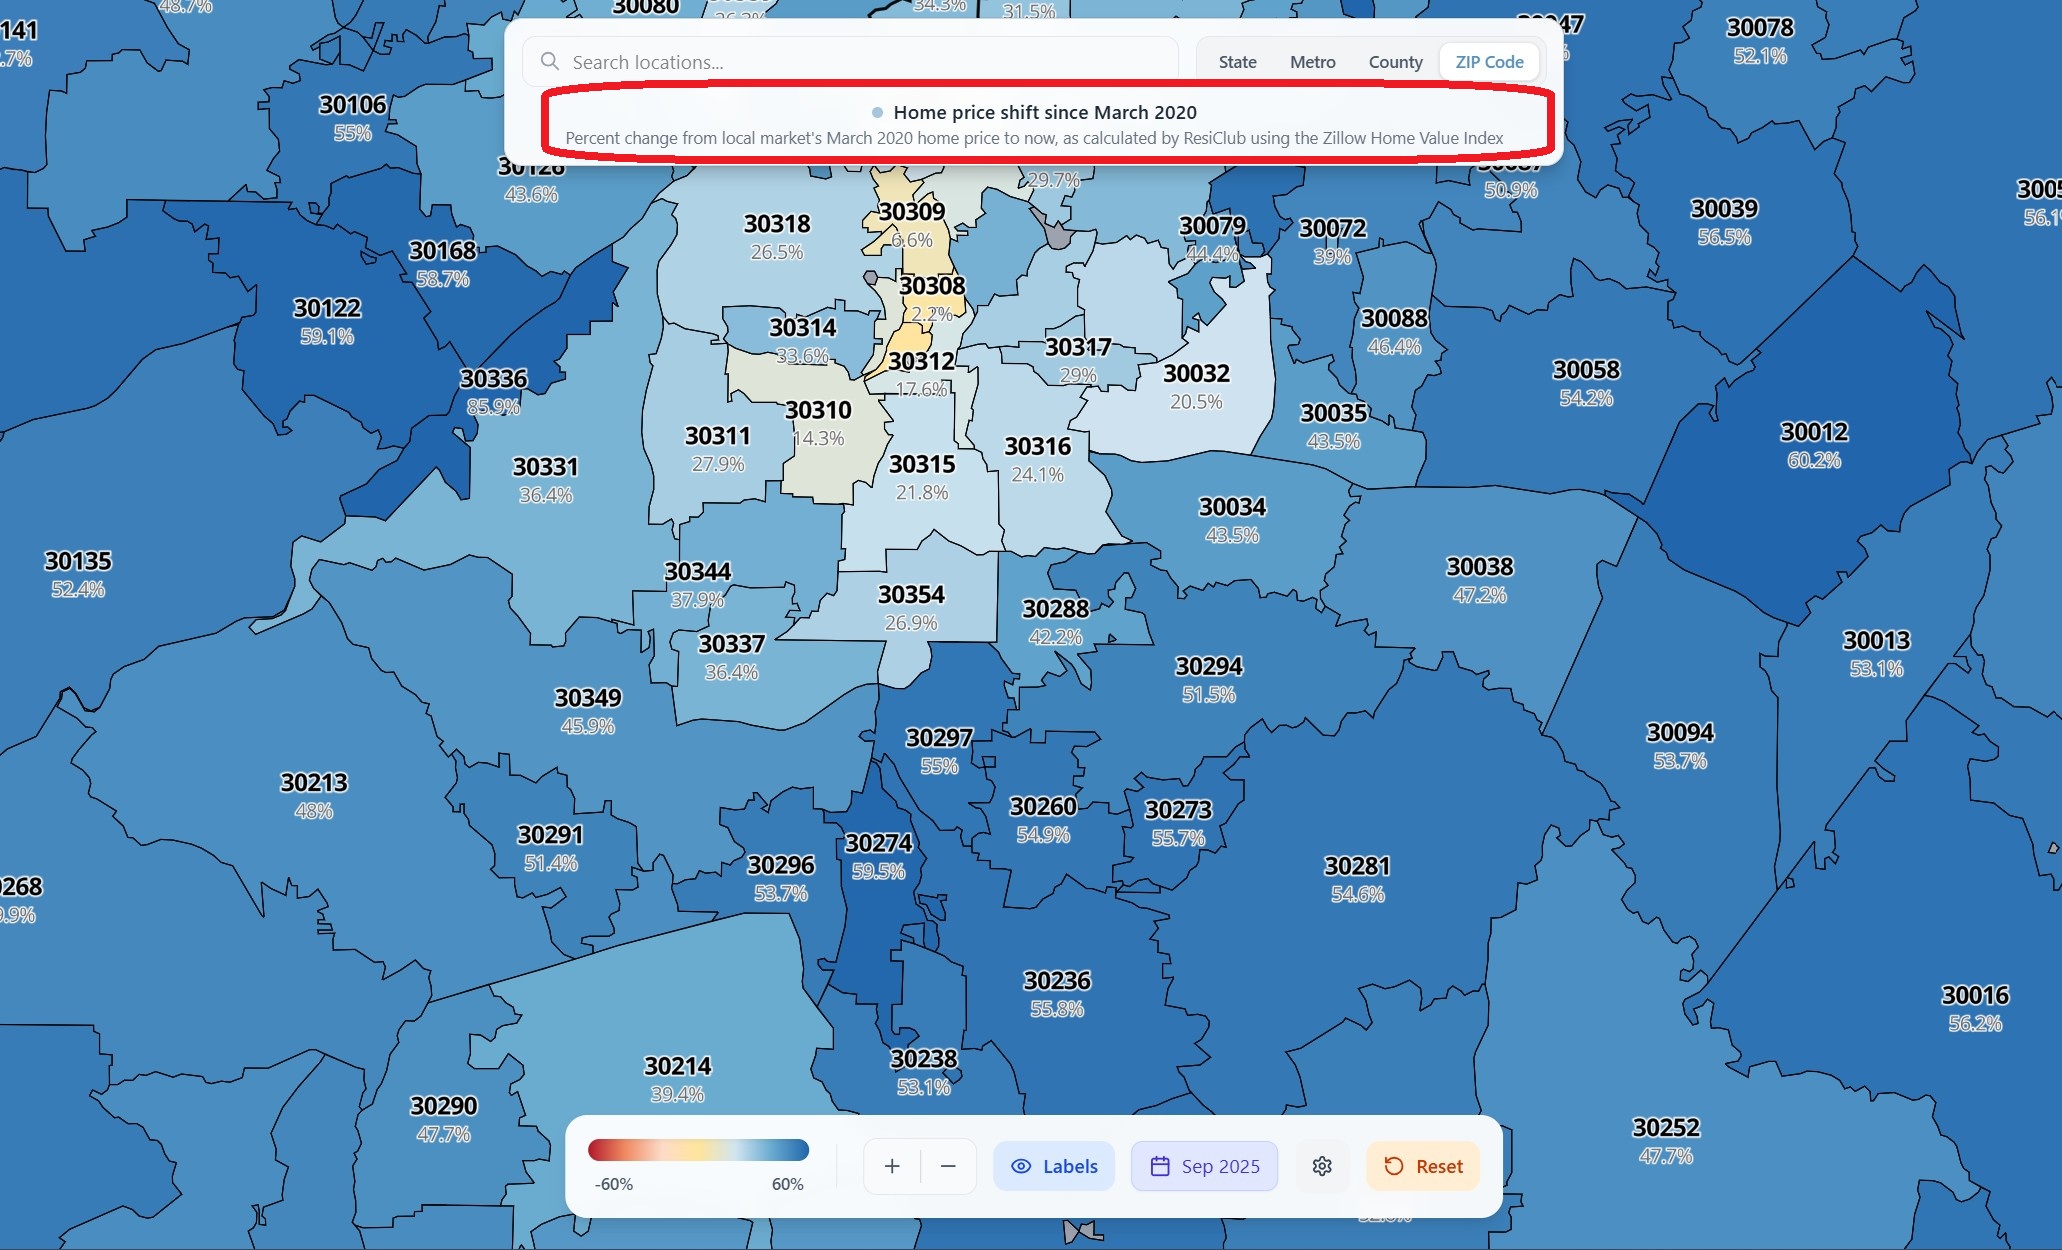
- The 5 year look at price trends is generally positive
- Some zips are struggling, marginally improved over this time
- These numbers will continue to shift due to the economy and buyer confidence
Deja Vu in Atlanta?
This area of Atlanta bears watching. These zips were smashed during the crash and many of the same trends may be underway. New construction, speculators, investors, and others returned here driven by low acquisition costs and lenders offering incentives for ownership.
Buyers were fueled by exceptionally low interest rates, new/remodelled homes, incentives, and the idea that values would continue to hold or rise. Many were at the max and could not handle increased taxes, insurance, utilities, maintenance, and other costs of ownership. In some cases, the hype for the areas fails to support the predictions being made.
In the end, all real estate is hyper local and markets are always moving. It's critical to look both at the macro and micro markets to ensure a full understand of current and historical trends. We love ResiClub and consider them one of the best sources for current market info - have a look!
The Hank Miller Team puts 35+ years of full time sales & appraisal experience to work for you. Act with complete confidence & make sound, decisive real estate decisions. 678-428-8276 and info@hmtatlanta.com Posted by Hank Miller on
Leave A Comment